dppd_plotnine
Welcome to dppd_plotnine, which converts plotnine to work with dppd and pythonifies it’s api.
It’s source lives at github.
Quickstart
import numpy as np
from dppd import dppd
import dppd_plotnine
from plotnine.data import mtcars
import plotnine as p9
dp, X = dppd()
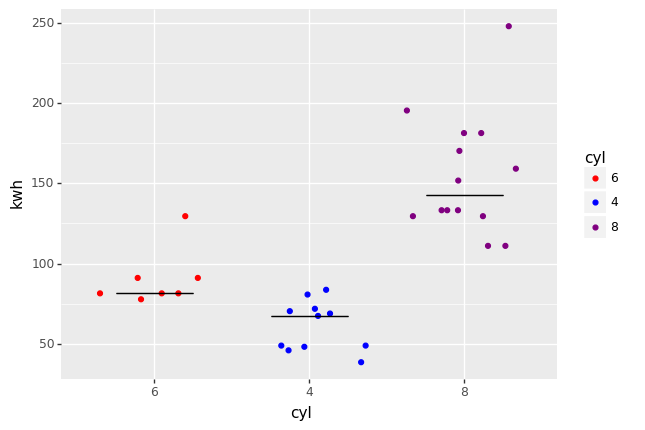
plot = (
dp(mtcars)
.assign(kwh=X.hp * 0.74)
.categorize("cyl")
.p9()
.add_point(
"cyl",
"kwh",
color="cyl",
position=p9.position_jitter(height=0, random_state=500),
)
.add_errorbar(
x="cyl",
y="kwh_median",
ymin="kwh_median",
ymax="kwh_median",
data=dp(X.data)
.groupby("cyl")
.summarize(("kwh", np.median, "kwh_median"))
.pd,
)
.scale_color_manual(
["red", "blue", "purple"]
) # after pd, X is what it was before
.pd
)
plot.save("test.png")
dppd_plotnine supports two different call conventions, one matching plotnine (and ggplot) and another, perhaps more convinient one, see call convention.